

Connect business data
Bring information from supported ERP, CRM, databases, files and cloud sources into a planned reporting architecture. Identify source owners and connection constraints before assuming every data source behaves the same way.
 MICROSOFT POWER PLATFORM
Turn disconnected business data into reports your people can understand and trust. Microsoft Power BI helps you explore performance, investigate the reasons behind a number and bring a shared view to everyday decisions.
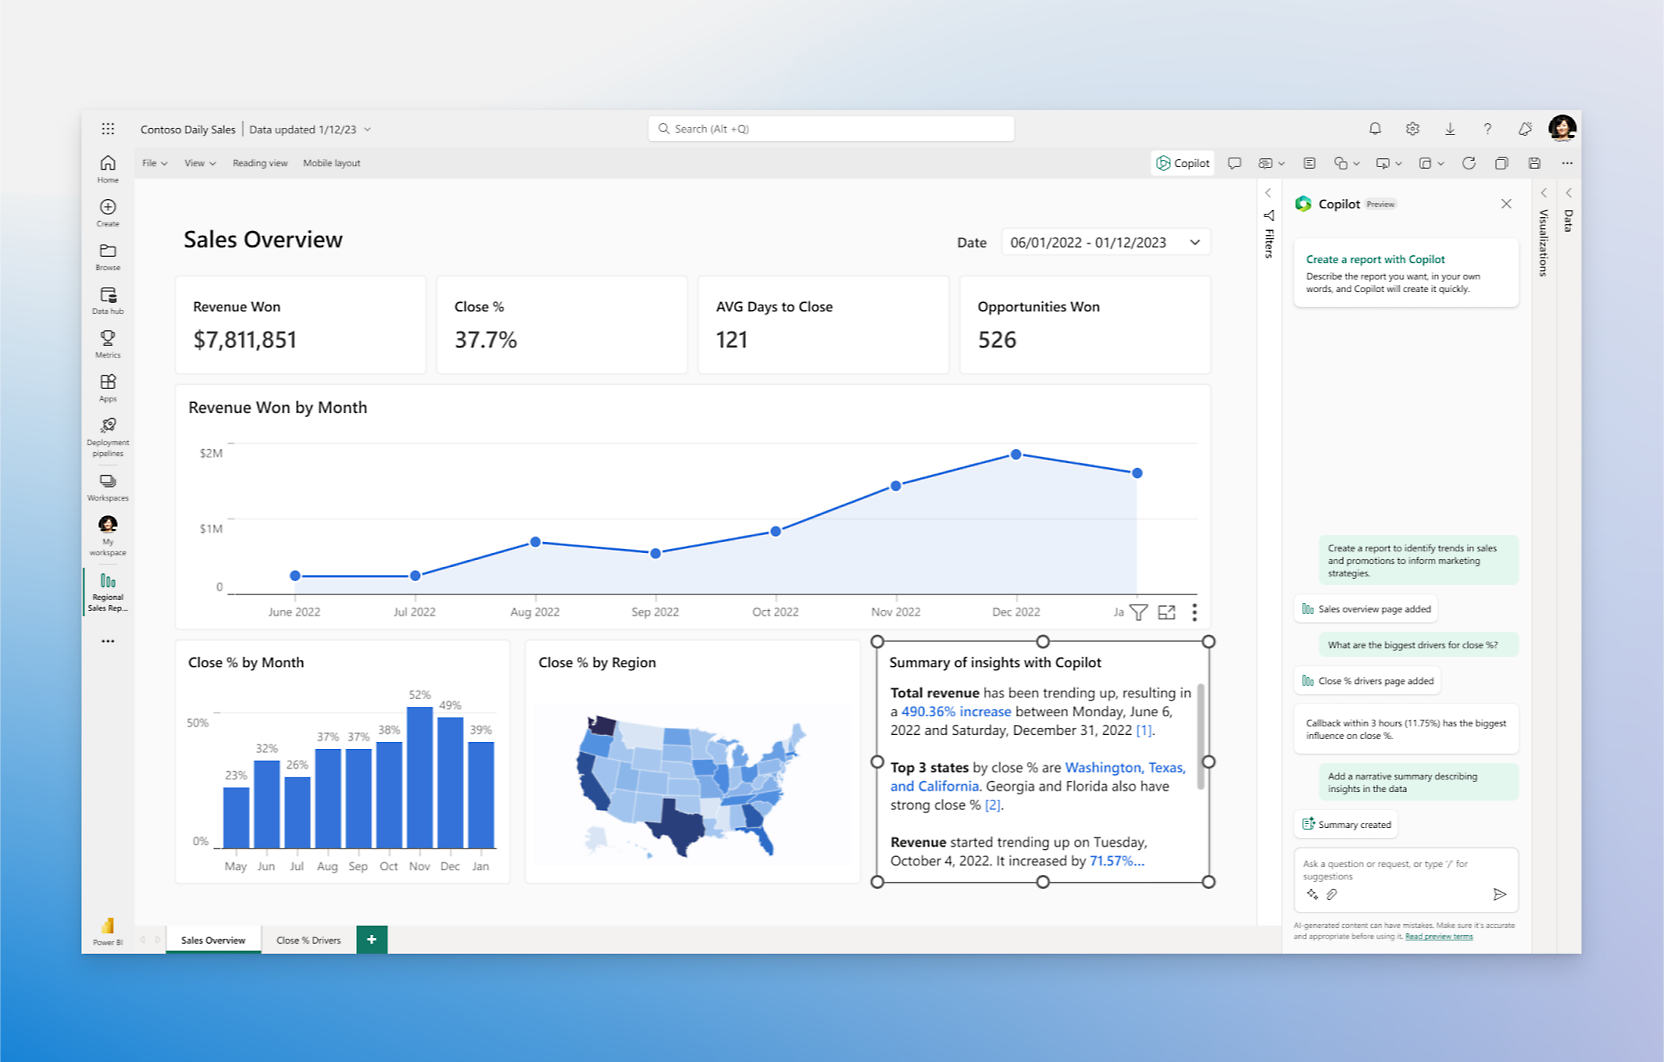 Explore the product view ↗
Microsoft product imagery. Interface and features vary by configuration.
Different businesses. Different ways of working. A shared need for technology that supports real operations.









For organizations that need financial, commercial and operational information in one decision-making process. Tripearltech designs Power BI around your business questions, data sources and the people responsible for acting on the results.
Bring information from supported ERP, CRM, databases, files and cloud sources into a planned reporting architecture. Identify source owners and connection constraints before assuming every data source behaves the same way.
Use appropriate data preparation to clean, combine and structure records. Agree the treatment of duplicates, missing values and inconsistent codes so report users understand what the figures include.
Build a shared analytical model with relationships and business measures. Define revenue, margin, stock and other indicators once where appropriate, instead of recreating different logic in every report.
Design reports with clear comparisons, filters and drill-through paths. Help users move from an overview to the records or business segments that explain a change, without overcrowding the page.
Connect measures to the decisions finance and operations make. Reconcile key totals with the source system and document timing differences before presenting a report as the management view.
Assess Import, DirectQuery and supported Direct Lake scenarios against freshness, performance and cost needs. Configure gateways where required; a connection does not automatically make every report live.
Publish through appropriate workspaces and apps, with licenses and access aligned to the audience. Design row-level security and test the identities that will actually consume the reports.
Assess print-oriented reports and embedded analytics separately from interactive dashboards. Confirm layout, export, identity and capacity requirements for the intended internal or external use.
Evaluate available Copilot experiences against your data model, permissions and capacity. Well-defined measures and human review remain essential; generated narratives should not substitute for validated business logic.
Power BI Desktop authoring, shared consumption, Premium Per User, Fabric capacity and embedded use have different licensing needs. Copilot also has prerequisites. We assess creators, viewers, distribution and workload before recommending a model.
Microsoft product overview ↗Connect Microsoft Power BI to the applications your people rely on. Define the business handoff, data ownership and permissions before adding another integration.

Build finance and operational reporting from agreed Business Central data. Validate API access, custom fields, company structures and reconciliation with posted results.

Analyze pipeline, conversion and account performance using agreed CRM definitions and reliable ownership of sales records.

Connect enterprise financial data to management analysis, with clear treatment of entities, dimensions, currencies and reporting dates.

Connect selected reporting experiences with an application for controlled business actions. Any write-back needs an explicit application and permission design.

Support defined actions and notifications around analytical processes, with monitored workflows and an accountable business owner.

Use supported connections to analyze structured business application data while respecting the intended access model.
Power BI is also a core analytics workload in Microsoft Fabric. Fabric can provide a broader data foundation when engineering, storage and enterprise analysis require it. Excel, Teams and SharePoint can support consumption; capacity, permissions and refresh design must still be assessed.
Explore Microsoft’s product details ↗Tripearltech provides Microsoft Power BI consulting, implementation and support from Ahmedabad, India, for businesses worldwide. Each engagement starts with your operating needs and a clear division of responsibility.
Review current reports, decision cycles and data availability. Agree priority questions and a manageable first release instead of reproducing every spreadsheet as a dashboard.
Design interactive reports around real users and decisions. Build a clear visual hierarchy, useful drill paths and practical filtering, then review the experience with the people who will use it.
Create business measures, relationships and calculation logic that can be maintained. Document definitions and test difficult cases such as returns, multiple currencies and changes in reporting periods.
Connect approved sources and define refresh, gateways and data preparation. Assess the need for a warehouse or Fabric architecture when direct reporting from operational systems is not suitable.
Review existing models, visuals, queries and refresh behavior. Identify duplicated logic, unreliable totals and bottlenecks before recommending targeted changes.
Train report consumers, authors and administrators according to their responsibilities. Establish publishing ownership, access reviews, refresh monitoring and a process for changing business measures.
The value of Microsoft Power BI depends on the process it improves. Explore common industry needs and the implementation decisions that help the solution fit.
Management sees output, inventory and financial results in different reports.
Agree common dimensions and timing, then connect production, stock and financial measures. Investigate variances through relevant sites, products and periods rather than adding more disconnected charts.
Sales growth hides slow-moving stock and working-capital pressure.
Bring sales, margin, receivables and inventory views together with reconciled definitions. Give teams a route from an exception to the responsible customer, item or warehouse.
Project managers and finance disagree on cost and profitability.
Define which costs, commitments and revenue belong in each measure. Reconcile the reporting model and distinguish approved actuals from estimates before comparing project performance.
Channel, location and product reports use inconsistent time periods and categories.
Build a consistent reporting model for the agreed sources. Review returns, promotions and product hierarchy changes so comparisons remain meaningful across channels.
Utilization and revenue are reviewed separately from delivery effort.
Connect approved time, resource and financial data with agreed definitions. Distinguish billable activity, invoiced revenue and available capacity before judging performance.
Group reports require repeated spreadsheet consolidation and manual explanation.
Create common reporting definitions and retain validated entity differences. Assess currency, access and data timing explicitly so consolidated views remain traceable.
Explore the Microsoft credential references relevant to this solution and its supporting implementation disciplines.
Power BI delivery needs sound modelling and a clear understanding of business measures. These Microsoft credentials reference Power BI analysis and the related Fabric analytics discipline; individual experience and credential records should be reviewed for the proposed team.
Discuss your project team ↗ Exam PL-300
Related reporting & analytics
View official credential ↗Exam DP-600Related Fabric analytics engineering
View official credential ↗Official Microsoft credential references, checked September 2026. These badges identify certification disciplines, not individual employee records. Related and retired credentials are labeled. Ask us about the verified credentials and practical experience of the specialists proposed for your engagement.
Before choosing charts, agree the questions and the numbers behind them. This guide helps you prepare data, measure definitions, access and reporting ownership.
Bring the right people and questions to your first implementation workshop.
Our Microsoft Power BI delivery approach makes design decisions, acceptance and readiness visible. The people who own the process stay involved from discovery through support.
Map decisions, existing reports, source systems and the users who need a clearer view.
Gate: reporting priorities and definitions agreedDesign data preparation, relationships, measures, access and refresh around the business questions.
Gate: analytical model and source ownership acceptedCreate reports and test totals, exceptions, performance and security with real scenarios.
Gate: measures and report behavior verifiedPrepare workspaces, access and licenses, then teach users how to interpret and investigate results.
Gate: audience and operational readiness approvedReview refresh failures, usage and changing business needs while controlling measure changes.
Gate: support and reporting ownership acceptedUnderstand the solution, its boundaries and how Tripearltech can support your implementation.
Let’s talk about your business ↗Power BI helps organizations connect, model, visualize and share business data. It is useful for management dashboards and detailed analysis, but its value depends on reliable sources and agreed measures. Tripearltech starts with the decisions your team needs to make.
Yes, supported connection options are available. We assess APIs, company structures, custom fields, historical data and refresh requirements. Key financial and operational totals are reconciled with Business Central before users rely on the new reports.
No. Freshness depends on the data source, connection mode, refresh configuration, gateway and capacity. We agree the required latency for each use case and choose an appropriate design rather than describing scheduled refresh as live reporting.
Power BI provides reporting, semantic modelling and analytical experiences. It is also part of Microsoft Fabric, which includes broader data engineering and analytics workloads. A reporting project does not automatically require every Fabric capability; architecture should follow the data needs.
Sharing and consumption rights depend on user licenses, workspace capacity and the distribution scenario. We assess Pro, Premium Per User, Fabric capacity and embedded use against current Microsoft terms. A free authoring tool does not imply unrestricted free sharing.
Row-level security and an appropriate access design can support restricted views. We test the real user identities, workspace roles and distribution method. Security should not depend on a report filter that a user can simply change.
Reporting alone is not a general-purpose ERP editing interface. Write-back scenarios need a separate application or integration with appropriate authorization, validation and error handling. Power Apps may be part of such a design when the use case fits.
Copilot can support analytical tasks where prerequisites are met, but it does not remove the need for a well-prepared model and validated measures. We review capacity, permissions and output quality before introducing it into business reporting.
Yes. We can review data models, DAX, query behavior, visuals, refresh and governance. The review identifies where totals, performance or usability need attention and provides a focused improvement scope rather than an automatic rebuild.
Yes. Tripearltech provides Power BI consulting, dashboard development, data modelling, ERP integration, training and support from Ahmedabad, India, for global businesses. The engagement is scoped around your data, reporting priorities and internal capabilities.